Infographics
A Center for European Studies intern created infographics that visualize EU institutions, the connections between them, and their impact on development and cohesion across EU member states. Our gratitude to Brett Harris for his work, to Davis Library Research Hub data visualization services librarian Lorin Bruckner for her advice and feedback on each infographic, and to Davis Library Research Hub digital research support specialist Tia Francis for her feedback as well. Click the buttons under each description to read the accompanying blog post, in which Brett details his design process.
Want to use the infographics in your classroom? Download the printable files!

A Brief Timeline of EU Institutions
This infographic visualizes the development of EU institutions. The timeline helps us understand that the current iterations of EU institutions are only the most recent of a long line of developments. For example, even though the European Parliament was created in 1957, it has undergone successive rounds of strengthening in various treaties. The growth of EU institutions is an ongoing story that began decades ago, and we can learn a lot by considering how different iterations came to be. Likewise, by locating these developments chronologically, we can gain further insight by considering the geopolitical/social/etc. contexts of the time.
The Process Behind the Timeline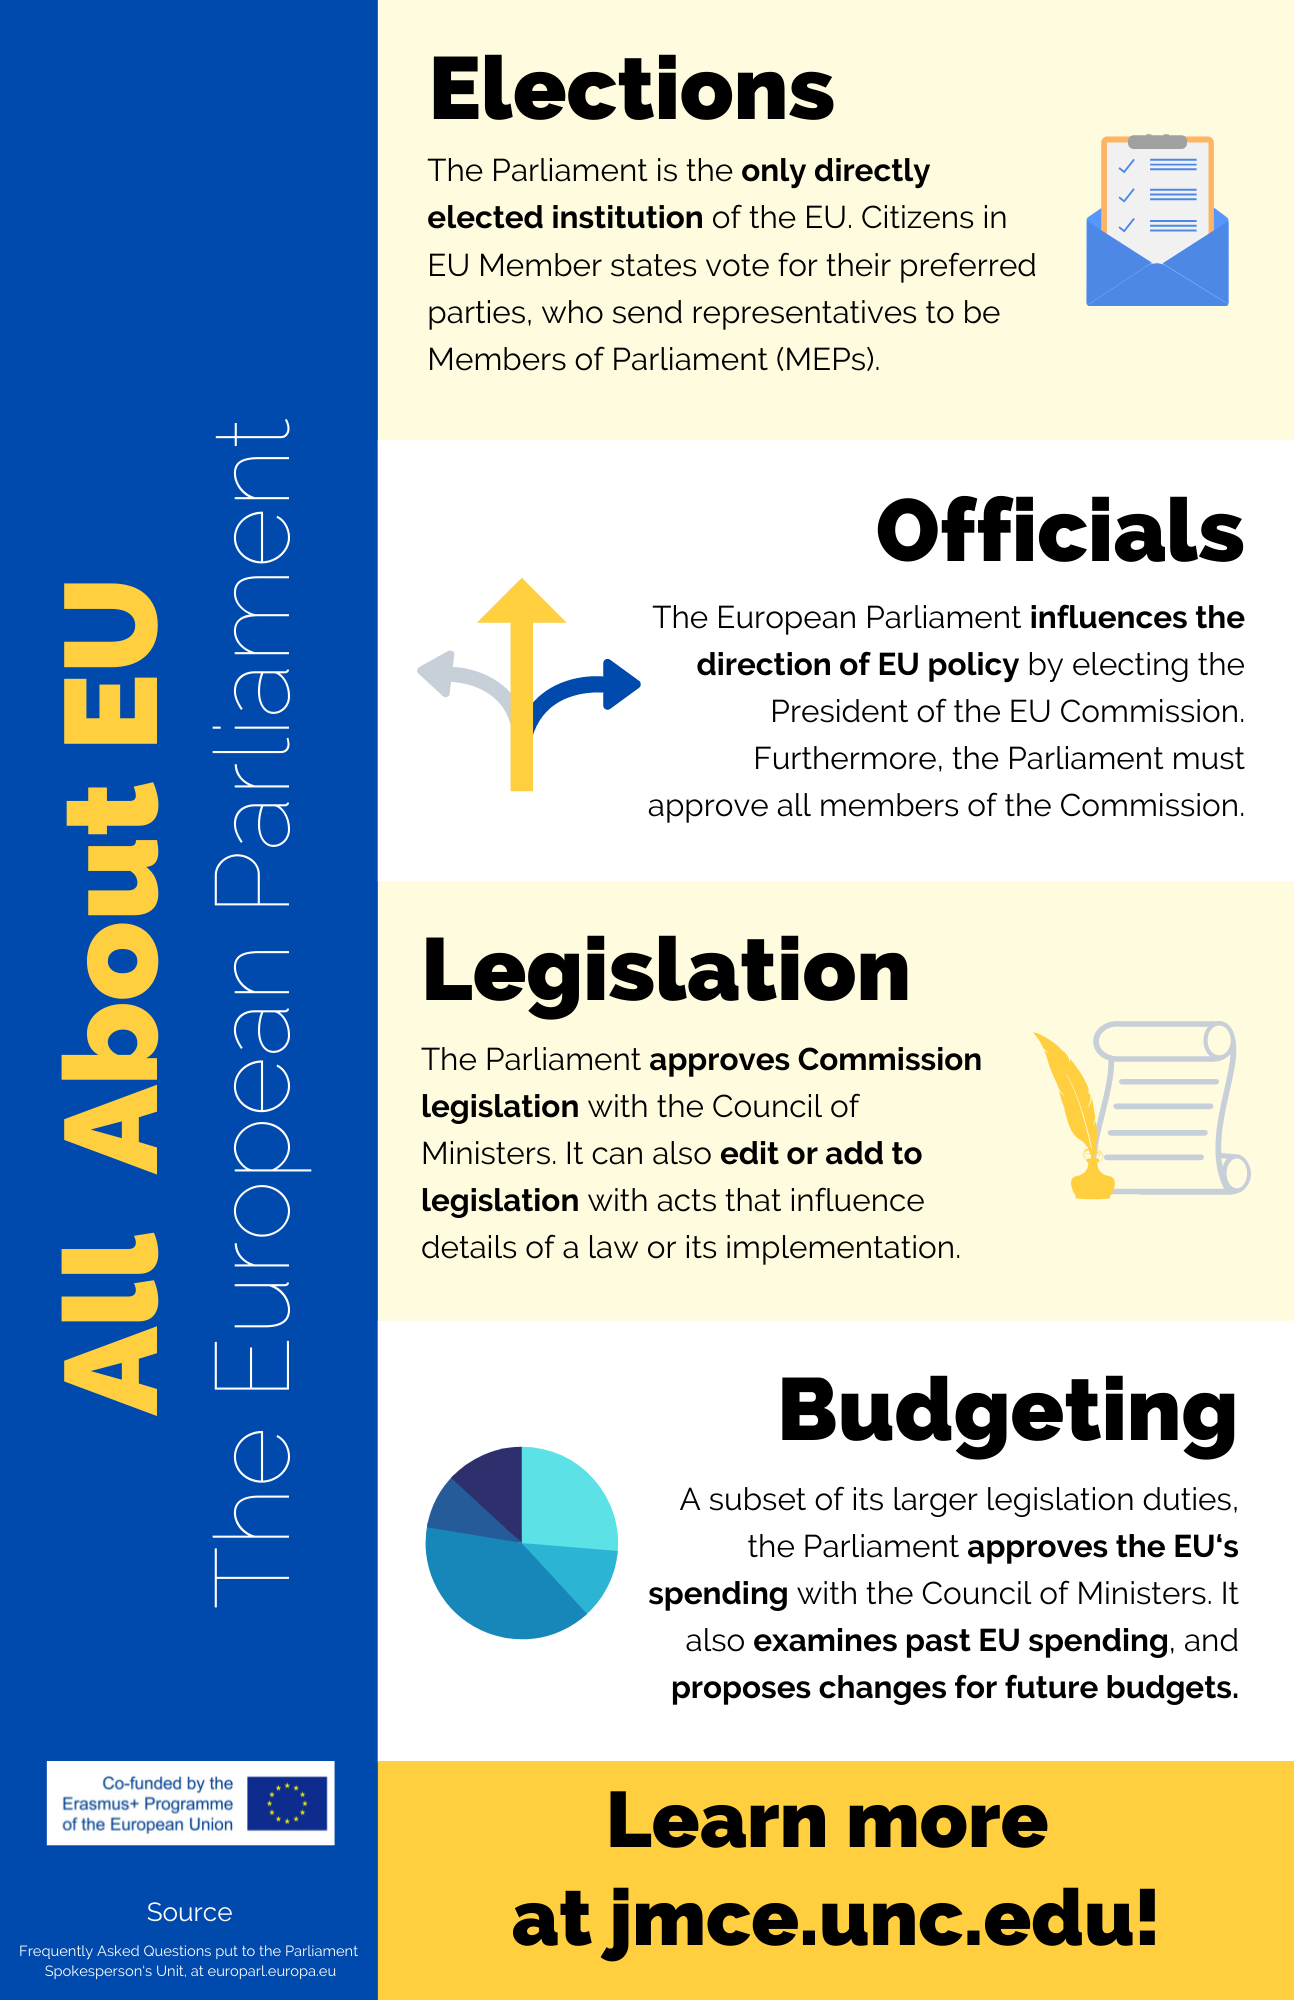
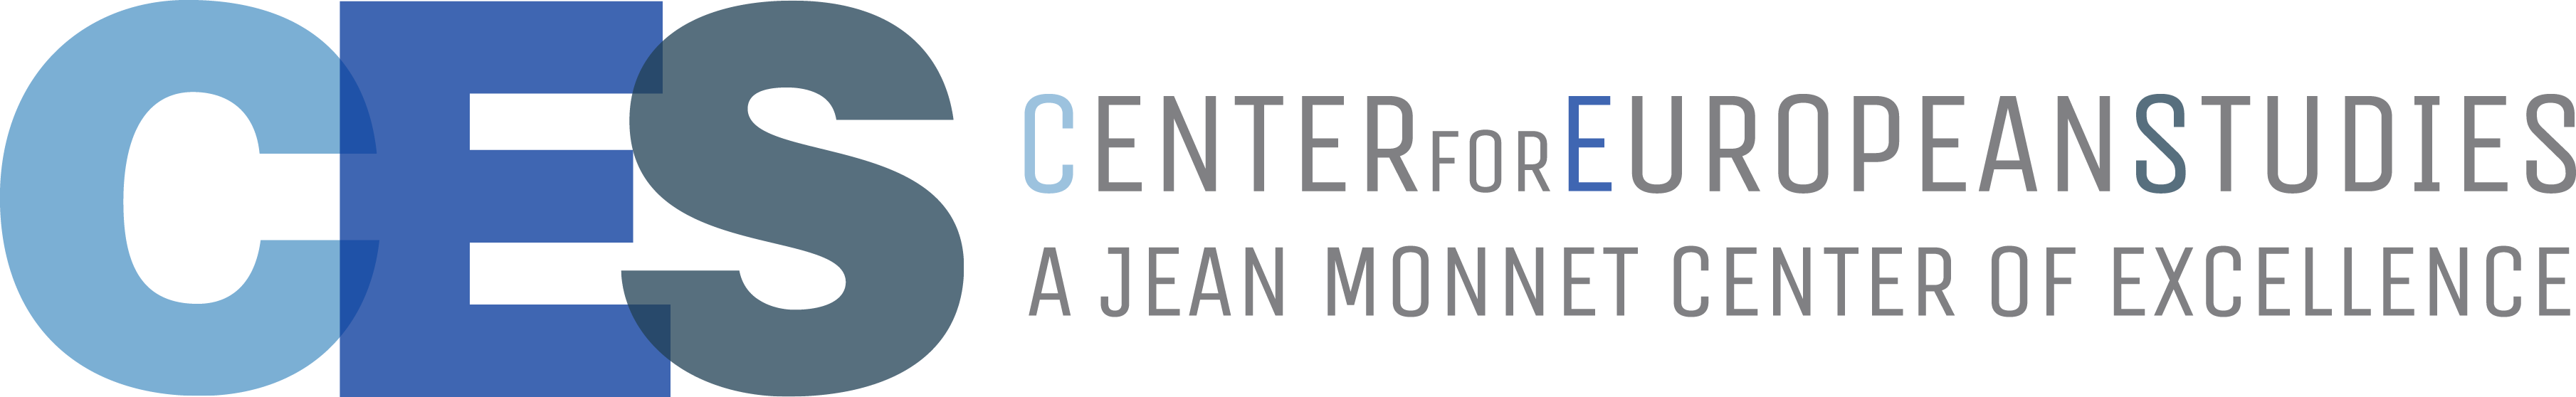
The European Parliament
With 705 members directly elected by EU citizens, the European Parliament is the largest of the EU’s three legislative institutions. It is the only directly elected institution in the EU, and influences the direction of EU policy by electing the President of the EU Commission. Alongside the Council of the EU, the Parliament approves legislation put forth by the Commission, as well as the EU’s annual budget.
Visualizing the Parliament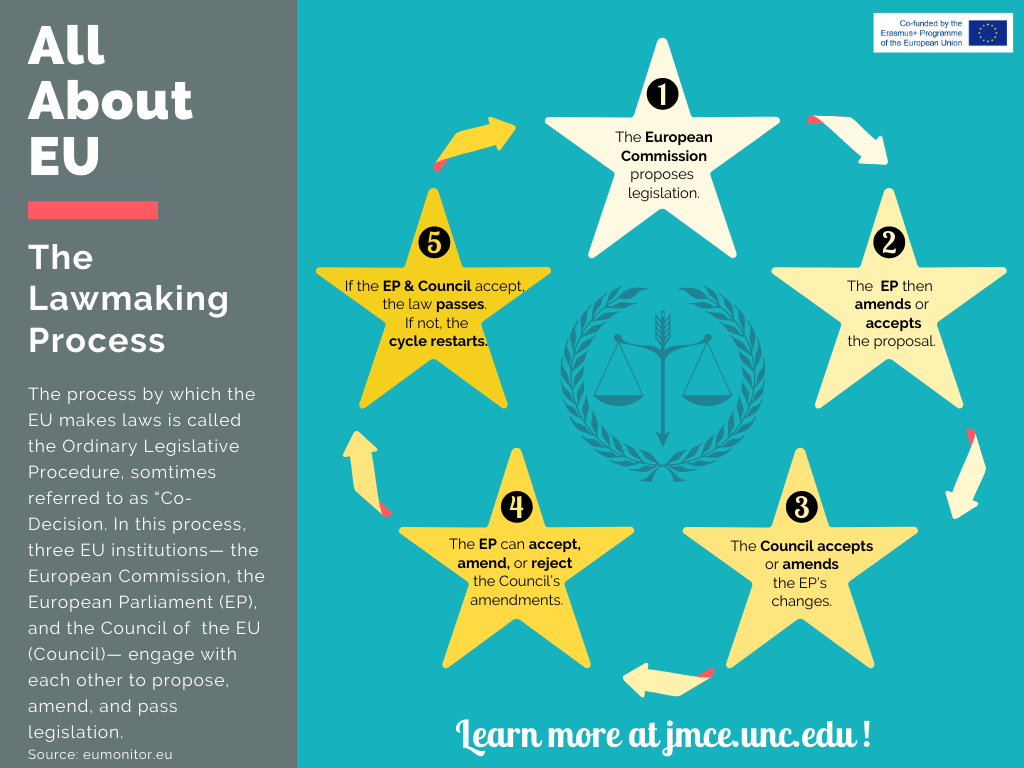
The Lawmaking Process
There are three legislative institutions in the European Union — the EU Commission, the EU Parliament, and the Council of the EU. The Commission holds the power to propose legislation, while the Parliament and Council of the EU are both tasked with approving and making amendments to new legislation. This infographic breaks down each step of the lawmaking process, detailing what action is taken by which institution.
Breaking Down the Legislative Process
The Seven Main EU Institutions
The EU’s main institutions are conceptualized as trading cards — color coded by responsibility. One executive, one judicial, two financial, and three legislative institutions all present their founding dates and summaries of their roles in the EU.
Conceptualizing Institutions as Trading Cards
The European Commission in Numbers
The European Commission has a lot on its plate! Breaking it down into a few statistics highlights the main mechanisms by which it functions. 27 Commissioners — one from each member state — carry out legislative and budgetary work. 33 Directorates-General draft and implement legislation across policy areas. 139 delegations represent the Commission’s work outside of the EU. And all are lead by one president.
Summarizing the Commission with Numbers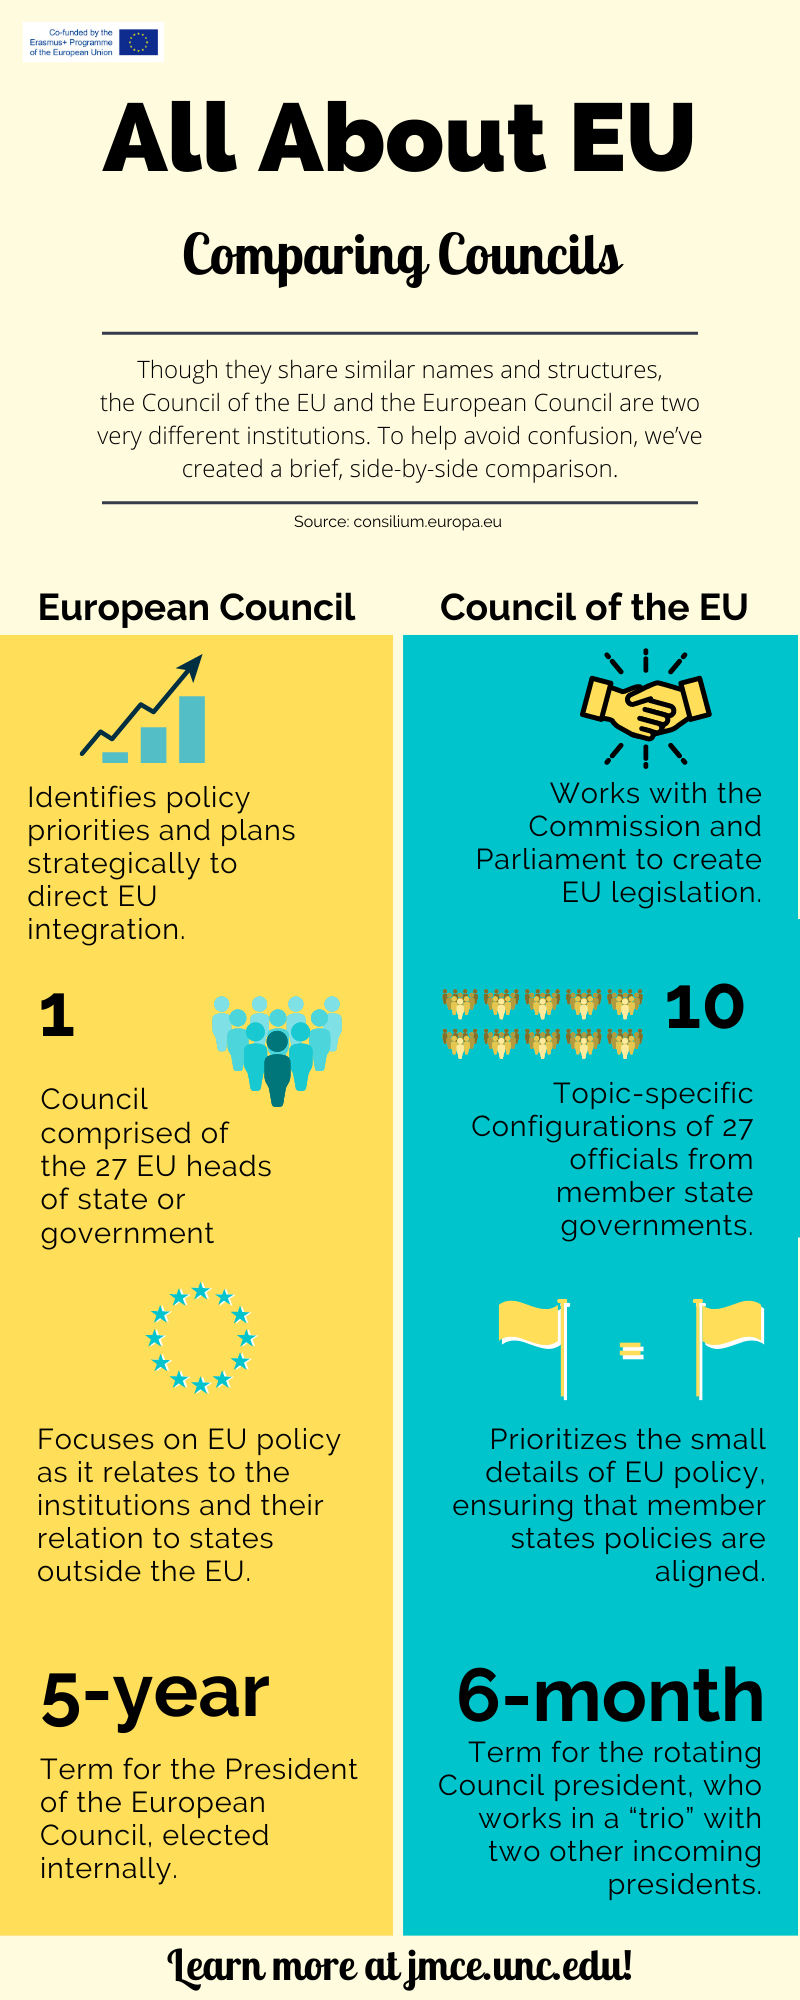
Comparing Councils
The EU has two different institutions with the word “council” in their names — the European Council, and the Council of the EU. The former comprises the 27 heads of EU member states, and focuses on long-term strategy for policy, foreign affairs, and integration. The latter also has 27 members — government officials each from a different EU member state, working to approve and amend legislation alongside the Commission and Parliament.
Comparing Councils in the EU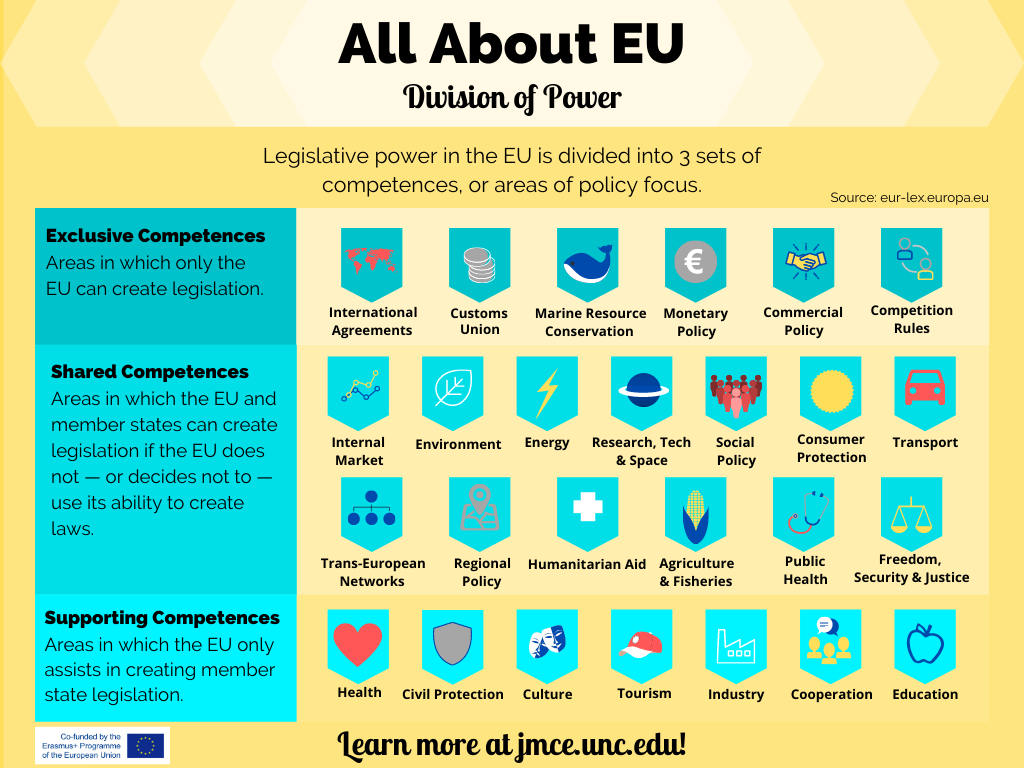
Division of Power
The EU has six policy areas where it has the exclusive right (over member states) to create legislation. There are an additional 20 policy areas where the EU shares lawmaking privileges with member states. These policy focuses range from public health and humanitarian aid, to social policy and security.
Categorizing Competences (or Powers)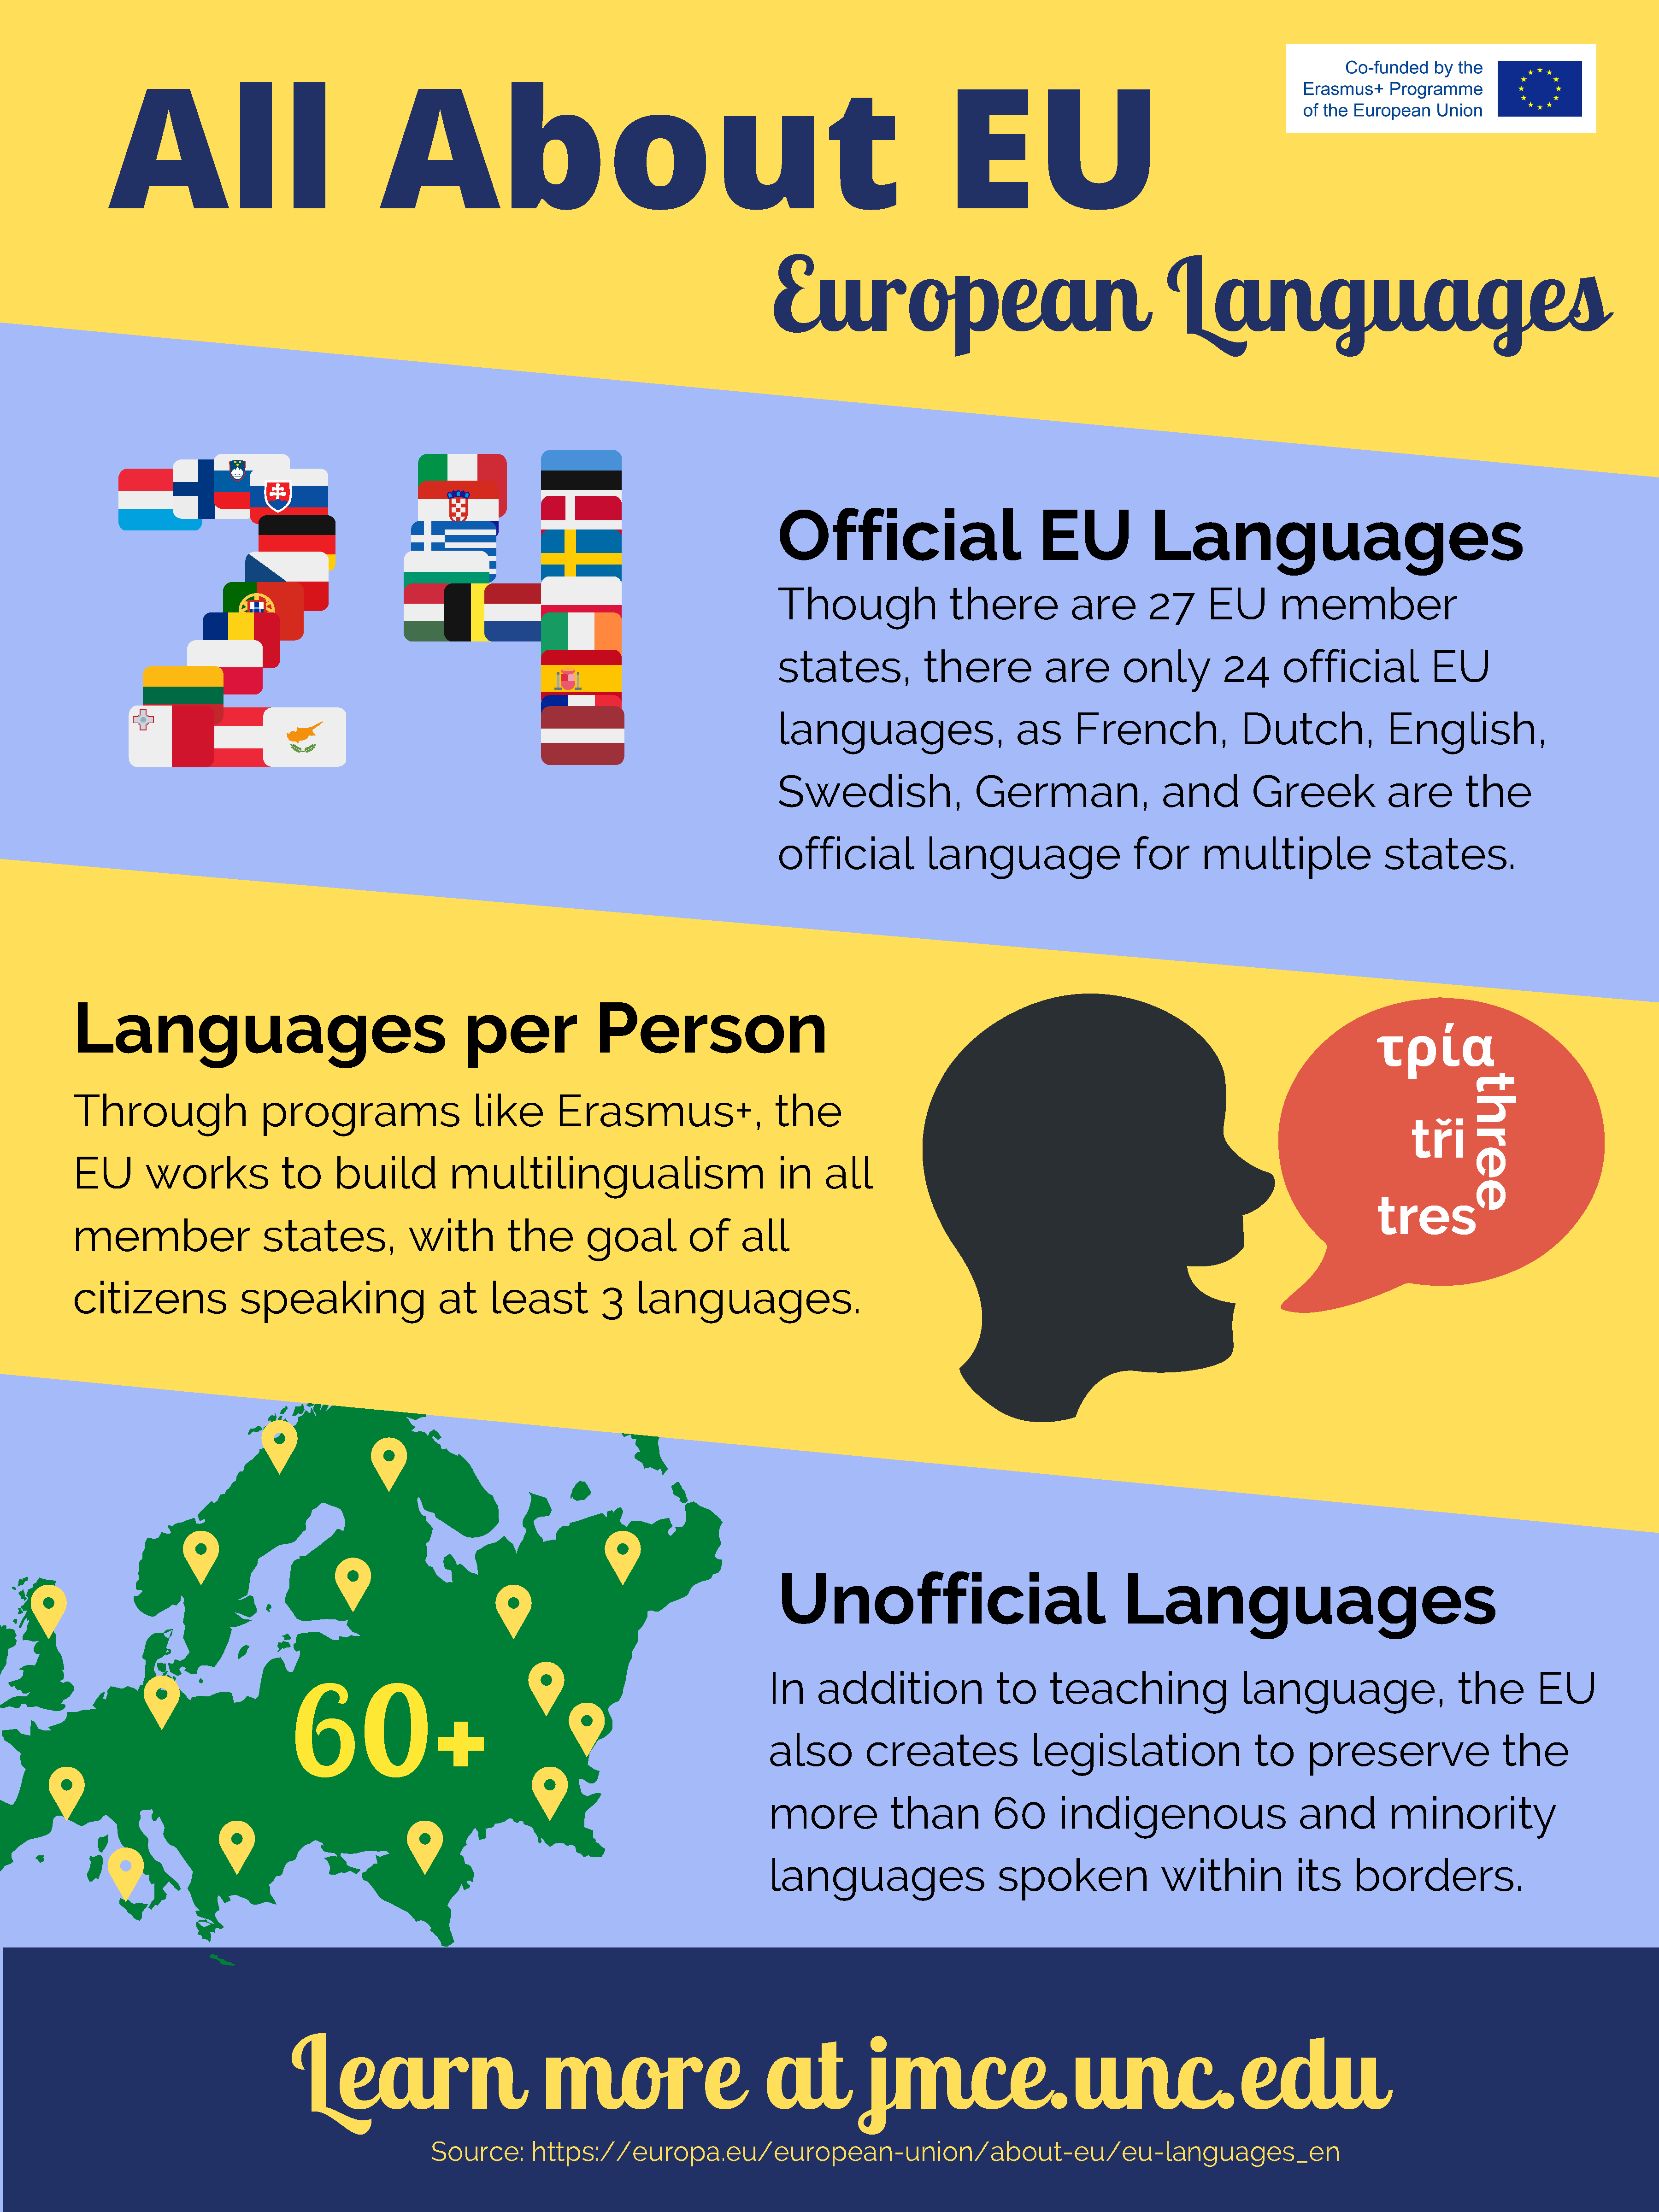
European Languages
24 official languages, 3 languages per person, and 60 unofficial languages — learn all about languages in the EU! From language policy to cultural initiatives like the European Union Prize for Literature, this infographic and accompanying blog post open the door to understanding what language means for a supranational body like the EU.
Learning (About) Languages
Bonus: Infographics 101
EURO major and CES intern Brett Harris created a bonus blog post, in which he walks through his creative process for making EU-related infographics!
Infographics 101